
The Basic Maths Of Every Business

People talk about finance like it’s a prestigious and daunting subject, but the foundations are quite straightforward.
The basic maths of every business can be summarised as:
Revenues – Costs = Profits (or Losses)
And pretty much everyone wants a business to make more money than it spends, so the revenues outweigh the costs.
Therefore, the first thing you need to be able to do is understand and draw up how those three numbers work in your venture.
We’ll look at them separately at first, then tally them up to see if you’re projected to make or lose money in your current setup.
You don’t have to be profitable today or tomorrow, but we want to see that profitability is possible in the future.
Revenue calculations
To forecast how much money will come in, we need an opinion on three important numbers.
They are important because increasing any of the three can drastically boost your income, and decreasing any of the three can quickly shrink your income.
Revenues = (number of customers) x (how much they spend) x (how often they come back)
All of these can be calculated, although you might feel that some of them are out of your control.
All we need for the time being is an educated guess for each number, and a sense of how we can calculate this in the future.

Estimating market size
We are asking ourselves “how many customers do we think we will serve?”, which can be further broken down into “how many potential customers exist?” and “how many of those potential customers will choose us?”.
There are two ways of looking at the market, Top Down and Ground Up.
Top Down is where we try to gauge how big a market is, then estimate what portion of that market we can win.
Ground Up is where we try to gauge how many customers we can realistically serve in a day or week, then estimate what that looks like over the course of a year.
Both are useful, and both have some limitations.
That’s why it helps to look through both lenses, see what’s in the middle ground, then do a reality check.
Here’s a great example from Guy Kawasaki:
“One way to improve your forecasts is to build them from the bottom up instead of the top down. Firstly, let’s review the wrong way: taking a huge number at the top and multiplying it by an easy-to-achieve market share.
Let’s apply this method to selling dog food:
According to the Humane Society there are 85 million owned dogs in America
Each dog eats two cans of dog food per day
The total market therefore is 170 million cans per day
Let’s assume, conservatively, that you can achieve 1% market share or 1.7 million cans per day
Let’s also assume that each can costs one dollar
This means your company will have $1.7 million in revenue per day, again being conservative.
This is a mere $620 million in annual revenue.
Now let’s examine the right way, which is to start from the bottom at zero dollars and estimate how many customers you can reach and close:
Using every SEO trick, partnership, and social media technique, you can get 50,000 visitors to your site per month.
One percent or 500 visitors will buy all 60 cans needed for the month, so monthly revenue is 500 people x 60 cans x $1/can = $30,000
You may get more visitors and improve your percentage of closed sales, but this is a realistic baseline: $30,000 per month or $360,000 per year
Three hundred and sixty thousand dollars is a long way from $620 million.
Maybe $360,000 is too pessimistic, but your actual results will be a lot closer to $360,000 than $620 million.”
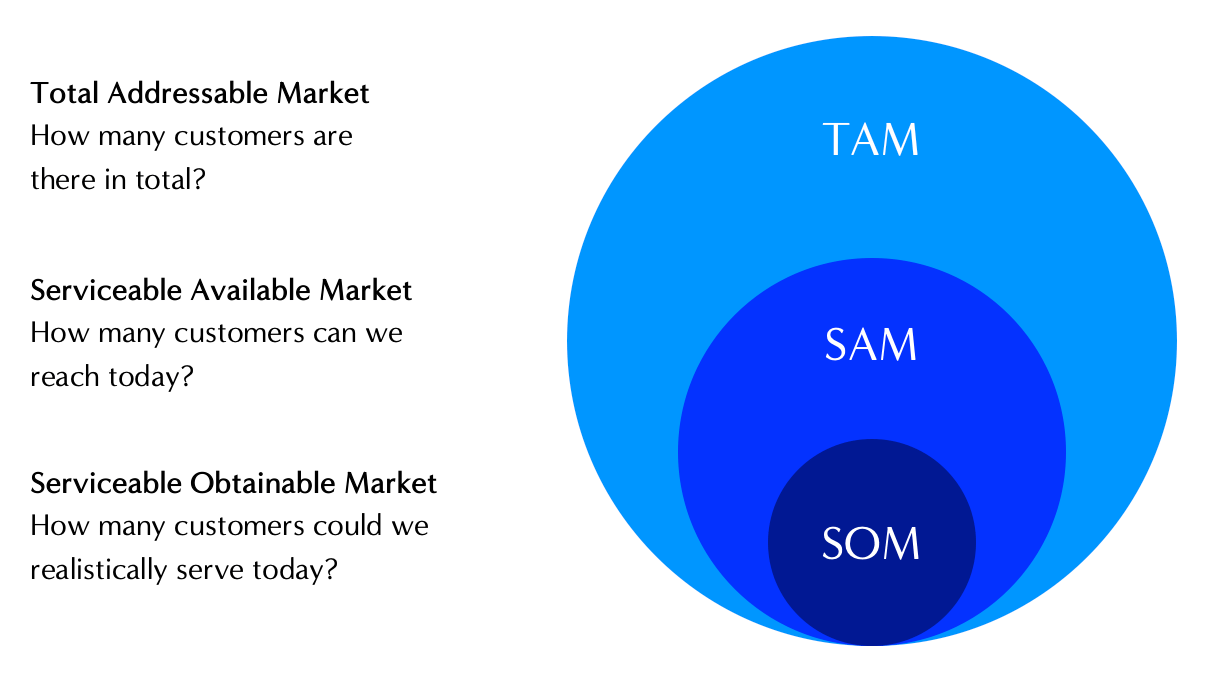
You’ll often see this when startups are asked about their TAM, SAM and SOM.
TAM stands for Total Addressable Market, meaning everyone who’s looking to buy something in this category in the near future.
SAM stands for Serviceable Addressable Market, meaning the part of the market who can be sold to in the near future.
SOM stands for Serviceable Obtainable market, meaning the part of the market who you can reach and realistically sell to in the near future.
So for example, TAM might describe “people in my town going on holiday”, SAM might describe “people in my town going overseas for a holiday”, and SOM might be “people in my town open to going on a cruise of the South Pacific for their holiday”.
The cruise market is a subset of the international market, which is a subset of the broader travel and leisure market.
The total market might even be measured in billions, but this includes people holidaying at home, their own beach house, a local Airbnb, a caravan, camping, or travelling for a specific interstate/international event.
If you’re running cruise tours of the Pacific, you’ll be aware that the vast majority of tourists won’t be your customer, but there’s still an impressive amount of prospective customers to meet today.
The Ground Up calculations force you to think about your capacity – how many customers can your team entice, serve and delight?
This number is influenced by how quickly you can meet, persuade and onboard customers, e.g. through hosting events, adding salespeople, paid ads or referral partners.
It’s also influenced by how many customers you can serve and retain, there’s not much use in ramping up your marketing if customers are then neglected and leave straight away.
If you run a shopfront or physical space, you’ll also have a sense of how many customers can be served at a time before it starts becoming off-putting.
At first, this will be limited by your team and the bottlenecks in your processes.
Eventually, your startup will want to have systems that can expand to suit however many customers are shopping with you.
The transition between the early days (where you do everything) and the scalable version (where systems run the business) can be tricky and costly.
Some founders advocate for “bootstrapping”, where you try to stick with simple/cheap options for as long as possible, and wait for the seams to nearly burst before expanding.
Some founders advocate for raising money and building bigger systems from the start, so that you don’t need to go through painful changes as you grow.
There’s plenty of examples of each approach working well, your job is to research what tends to happen to businesses specifically like yours.
Setting your prices
Pricing is important to get right, and a surprisingly touchy subject.
You are assigning a number to what you offer your customers, declaring its “worth” and hoping that the market agrees with you.
The way a product or service is priced tells the customer a story – real or imagined – about its quality, what they can expect and whether or not they want to go ahead with a purchase.
You probably have this in your own shopping – sometimes you are looking for the cheapest possible solution to your problem, sometimes you want a good option at a competitive price/discount, and sometimes you want to buy something that is reassuringly expensive.
e.g. you look for the cheapest petrol in your neighbourhood, but won’t order the cheapest wine on a date.
Or you might avoid a $50 pair of shoes, but happily take a $100 pair of shoes advertised at 50% off.
Or you might hear about an interesting new productivity app, flinch at paying $2.99 to download it, but then pay $35 for a book on that same subject, or $1,500 for a health retreat.
These can seem irrational, but we usually have some sort of justification for it in our heads.
Your job is to understand how customers interpret and respond to prices in your industry, so that you can make it easy for them to take action.
There are three main approaches to setting prices, and you’ll want to explore each of them before locking in numbers:
Cost-Plus Pricing is when you add up the true costs of serving a customer, then add a margin, and that sets your price.
You’ll see this in supermarkets, so when a product becomes more expensive to them, they simply pass on that increase to their customers.
This approach ensures that you’re never losing money, always making a consistent margin.
Market Based Pricing is when you look at all of your rivals and competitors that your customer is choosing from, and find the range that you can comfortable sit in.
The key detail here is “that your customers are choosing from” – if other similar organisations are much cheaper or much more expensive in a different city/country, they aren’t a relevant comparison.
If you were setting up a hotel in your town, you could find what the other hotels charge, particularly the ones with a similar star rating to yours, and that would give you some clear parameters for your prices.
Too high can be off-putting or prohibitive, too low can be suspiciously cheap or attract troublesome customers who are never satisfied.
The third approach, Value Based Pricing, considers what your solution/offer is worth to the customer.
We need to understand what the customer is willing to pay, even if it is based on very specific market conditions and sensitive timing.
For example, food inside a sports stadium is priced significantly higher than in a shop near the stadium, because they have customers over a barrel.
A city’s most expensive coffee probably isn’t the best coffee, but rather the coffee they sell at the airport or at a resort.
Easter chocolate is expensive right up until Easter Sunday, then it instantly drops to half price.
Did the quality really degrade that much in a day?
No, but its value as a gift drastically diminished.
This is why a signed jersey becomes so valuable to the right sports fan, but adds no value to anyone who doesn’t follow that competition.
You need to consider all of them.
The price you choose has to be:
Higher than your costs, or you lose money on every sale.
In the ballpark of the rest of the market, or customers steer clear.
Lower than the value to the customer, or they will shop elsewhere or choose to do nothing.
The same product can be sold at several different price points, depending on its context.
A beer can be sold for $3 in a bottle shop, $10 at a bar and $15 at a music festival.
Chemically it’s the same product in all three scenarios, but the customer, their choices and the vendor’s costs are drastically different.
Businesses also focus on the customer’s basket size – how much they buy in one transaction.
There is an incentive to nudge customers into buying more, with enticements like discounts or free shipping to encourage an additional product or service.
This is why clothing stores bring you lots of suggestions of garments to try while you’re already in the changing room, where you’re more receptive to trying something else on.
It’s why companies would rather offer “Buy two get one free” than offer a 20% discount, they’d rather a larger purchase with smaller margins.
Or perhaps you’ve seen ecommerce sites or fast food restaurants push add-on suggestions as you go to the payment screen – tacking on some extras once you’ve already decided that you’re buying something.
This is sometimes described as the customer’s “Average Order Value”, made up of the prices they’re paying and the number of items they’re buying.

In terms of prices, what do customers compare us to?
Dave Trott has a great story about positioning in supermarkets:
“Years back I was speaking to someone at Benton & Bowles.
They were explaining a problem they’d had on Jacobs Mallows.
These were little biscuits bases, covered in chocolate, topped with jam, then covered in marshmallow and coconut.
They weren’t selling well at the time.
No one could work out why.
They tasted great, people loved them.
So the planner did something that clever people never do: the obvious.
He went to the supermarket.
He looked at the product on the shelves, and watched how people behaved.
People would come along to the biscuit section.
They’d look at the price of Jacobs Mallows.
Then look at the price of comparative biscuits.
They’d realise they could get a packet of 16 custard creams for the same price as a packet of 6 Jacobs Mallows.
So they’d buy the custard creams.
That was the insight.
The problem wasn’t the product.
The problem wasn’t the brand.
The problem was the competitive set.
What came next was the idea.
Benton & Bowles suggested to the client that they move the Jacobs Mallows along to the cake section.
Then the planner went back and watched the shoppers.
They looked at the price of the Jacobs Mallows.
They looked at the price of comparative cakes.
They realised they could get a box of 6 Jacobs Mallows for the same price as 2 cakes.
So they bought the Jacobs Mallows.
That was an insight that lead to an idea.”
What are you being compared with?
How might you encourage customers to compare you with something else?
Something which highlights your strengths?

Retention and churn
It’s nice to have a lot of customers and it’s nice to have high prices, but what’s really nice is having repeat business.
It is generally more lucrative to have happy customers who come back, rather than squeezing every cent out of someone once.
This is also why you’ve seen so many companies move to a subscription model, they want you to pay a “reasonable” amount every month, rather than a one-time payment.
Keeping customers is called Retention, and we can estimate how long a typical customer tends to stay engaged with your business.
Losing customers is called Churn, and we can track how many customers stop shopping with you each month.
You might think “Money is money, who cares who’s paying it?”, but churn rates can reveal concerning trends.
Let’s say you have 200 subscribers in Month 1, 220 in Month 2 and 250 in Month 3.
Something is clearly working.
But what if you find that each month, you lose half of your customers, then replace them with new ones?
That would give you a warning sign – something is causing customers to cancel their plans with us.
Were they the wrong fit for the business?
Did we under-deliver?
Did someone else entice them away?
This is why cafes offer loyalty cards, with the 8th or 10th coffee being free, so that you form a habit and make their venue part of your weekly routine.
It’s why some car dealerships offer free car washes when you buy a vehicle with them, or throw in some sort of bonus at the end of a sale.
They want you to come back for services, repairs and eventually another car.
A lot of large companies will have a retention team or have retention offers – if you try to close your account, they can suddenly offer you discounted rates or cash incentives to stick around.
In almost every case, retention is valuable and churn should be minimised.
There are different studies with different figures, but it’s generally said that keeping a happy customer is 5-10x cheaper than winning a new happy customer.
For that reason, we’re going to watch how long our customers stay with us, to check if we’re living up to our promises.
So that’s our revenue calculation: customers x what they spend x how often they come back.
Whenever you have three numbers multiplied together, you only need to improve one number to see significant growth.
e.g. keeping the same number of customers, but increasing retention by 20%, or keeping the same customers but boosting their average order value.
The reverse is also true, dropping any one number will see a decent reduction in revenue.
e.g. 20% fewer customers or a higher churn rate will decimate your income.
You’ve seen in the examples above that most businesses are engaged in making calculated trade-offs.
They are balancing and measuring how much they are willing to sacrifice in one category, in order to boost another category.
For example, they might target fewer, higher paying customers.
Or they might offer discounts in exchange for larger order sizes.
Or they might annoy customers with extra offers and screens at the checkout, because it leads to more sales overall.
Or they might spend money to keep their loyal customers happy, because it will pay off with higher retention rates.
Let’s look at some of those trade-offs and see how they work, to give you some options that might work for your business…

Cost calculations
Everyone gets excited about revenue and revenue growth, but controlling your costs is equally influential.
Finding ways to save money is one of the fastest ways of becoming more profitable, and can reduce the pressure you feel as a founder.
There are several approaches to controlling costs, and both extreme ends of the spectrum tend to be troublesome.
High-growth venture-backed startups are told not to worry about costs in the early days, burning lots of cash to gain dominance in a market then make changes once they are a monopoly.
Bootstrapped and small businesses are told to watch every penny, pulling back on any expense that they can get away with.
It’s not that these approaches are wrong per-se, they have worked well in certain situations, but they can be taken too far.
Rapid expansion can lead to a lot of wasted spending and excess.
Frugality, especially the online frugal communities, leads to misery and anxiety, lots of second-guessing of every purchase and delayed growth because you won’t take any chances.
That’s why we want to be conscious and smart about our costs, but willing to try some low-risk experiments and to go the extra mile for our customers.
There are three types of costs – variable, fixed and startup.
Variable Costs
You might know how much Netflix costs for you, but how much do you cost for Netflix?
When they add a subscriber, what do they need to spend money on?
This is the world of variable costs – the amount a business spends to serve each additional customer.
These are often the “cost of goods sold” or COGS, they are usually quite consistent and easy to measure.
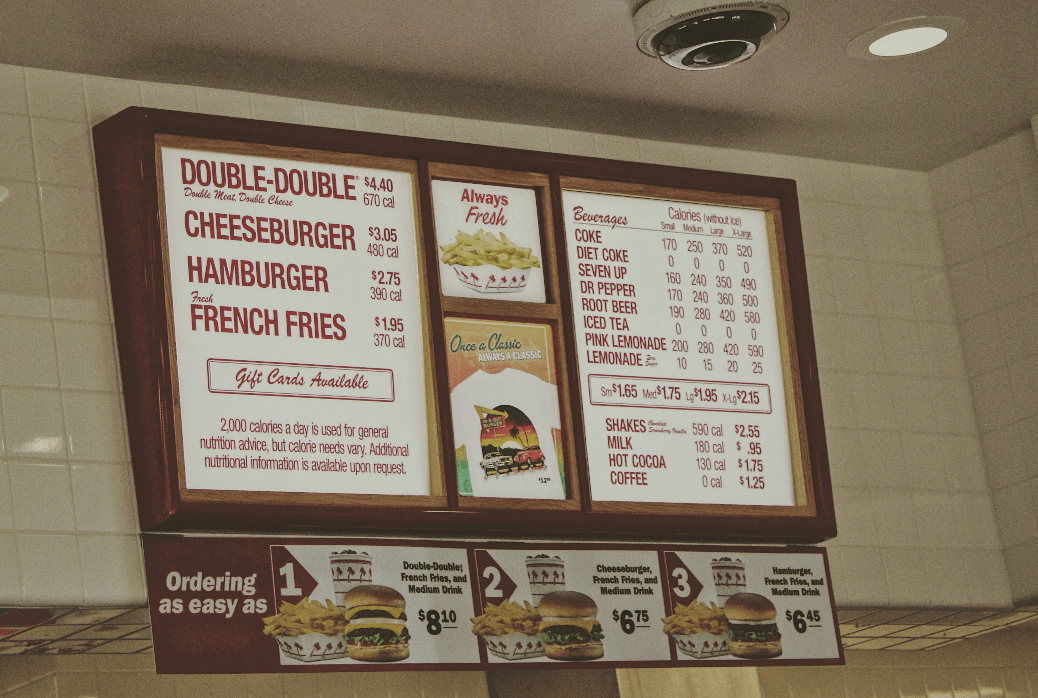
Restaurants aims for COGS of 30-35-40%, so a $25 main cost them $8-9 in ingredients and labour.
Petrol stations have COGS closer to 90-95% for fuel, making hardly anything per litre, but making more money from their drinks and chocolate bars.
Products sold on infomercials have COGS around 17-20-25%, so the customer pays a lot for something that doesn’t cost all that much to manufacture, but then the cost of the commercial makes it more expensive.

There’s a good chance you’re not making products or delivering services one at a time.
When you go to the for a dental checkup, the receptionist, hygienist and dentist didn’t all come in to work that day for just your appointment.
The baker who made your croissant didn’t just make one.
They serve several customer in batches, which is much more efficient - the dental team served 20 customers, the baker made 40 croissants,
We can take their cost of serving everyone and divide it by the number of customers served.
You can do this in your work, calculating the batch cost of serving several customers, and dividing to find the cost per customer.
You might be wondering “what counts as a variable cost? Is the dental clinic a variable cost, or the gas for baker’s oven?”
The general answer is “any cost that goes up when you serve one additional customer”, that’s the variance in variable costs.
The rent and electricity of the dental clinic won’t change if they have 10 customers in a day rather than 20, and the oven doesn’t work much harder to bake 20 croissants rather than 40.
If the dentist attracts customers through a big billboard, that’s not a variable cost, as it doesn’t cost and more/less when a new customer sees the billboard and makes an appointment.
However, if the dentist is using Google Pay-Per-Click marketing, paying an average $11 per new customer, then that would be a variable cost, as more customers cost more, and fewer customers cost less.
Fixed Costs
If you spend a consistent amount of money on something, no matter how busy you are, then it’s likely described as a fixed cost, or “Overhead”.
These are costs like rent, insurance, machinery, some types of management and admin staff, utilities, vehicles, computers and branding.
Imagine a public holiday – you’ve taken the day off and aren’t directly serving any customers.
What expenses are you still paying that day?
Those are probably your overheads, you probably don’t pay for them in cash each day, it might be by month, quarter or year, but we can also calculate them by day.
Different business owners have different perspectives on overheads.
Some see overheads as being much cheaper in the long run, and some see overheads as an expensive burden.
i.e. the decision to rent or buy a piece of equipment, or to contract a specialist versus hiring them full time.
These choices are tricky because owning something is likely cheaper per-day or per-project if you’re using it a lot, but hiring is better deal if you only need it infrequently.

Startup Costs
These are a slightly different category because of their special circumstances – costs that you pay right at the start of your business, then don’t have to think about for years.
e.g. paying for a designer to make your brand identity, building you app, setting up your office or retail space, manufacturing costs in creating moulds or initial product design, etc.
They feel like overheads, but they’re not ongoing expenses.
Some founders need to spend $60,000 before they can serve their first customer, some high-tech companies might spend $6M, and some freelancers can serve their first customers with materials and resources they already own.
There are no strict rules, but generally speaking most entrepreneurs do not need as many startup costs as they think they do.
There are some costs that are essential or risk-reducing, but in a lot of cases, founders want to have a nice version of everything to avoid embarrassment, rather than because they’re necessary for the business.

Margin calculations
Now that we have a sense of how much revenue is coming in, and how many costs are going out, we can see how much margin is left over.
There are a few numbers here that are helpful for our financial clarity:
Gross Margin = Price – Cost Of Goods
e.g. you sell a $10 product which costs you $6 to make and deliver, giving you a gross margin of $4.
This margin isn’t what you’d consider to be “profit”, as we still have to pay for all of the other costs involved in running the business (like those pesky overheads).
This is sometimes called your Contribution Margin, because that $4 can now contribute to covering your other costs.
So when you make $10, it’s really $6 for the sale and $4 for the business/you.
Breakeven Volume = Overheads / Gross Margin
If we know what our daily/weekly/monthly overheads are, and we know what we make from each sale, we can work out how many sales we need to break even.
So if you sell a subscription that costs $20 a month, and your contribution margin is $15 per customer per month, and your monthly overheads are $2,000:
$2,000 divided by $15 = 134 subscribers to break even.
Every cost you add into your business will push that breakeven volume higher, and every cost you can minimise or eliminate will make it lower.
Margin of safety = Current Volume – Breakeven Volume
This is the gap between your sales and your breakeven point, so that you know when to put more focus on generating immediate revenue.
This is useful for answering questions like “can we afford to spend more on…” or “are we going to break even this month?”
Net Profit = Revenue – Cost of Goods – Overheads – All Other Expenses
This is when you tally up all income and all expenses and see how much is left over.
It’s straightforward, it can come as a shock, but it’s the number that shows you how profitable your business is for you, right now.
This is slightly different to…
EBITDA = Earnings Before Interest, Tax, Depreciation and Amortisation
Let’s say you and your enemy both start rival companies.
You run your super lean, using cash to pay for your setup and with equipment you already owned.
Your rival took out some big loans on their credit cards, and bought fancy, shiny equipment.
If your companies sold the same amount of products to the same sort of customers at the same sort of prices, you’d take home different amounts of money.
That’s because they have to pay interest on their debts, depreciate their assets, and maybe they’re in a different tax situation to you.
You each have a different conclusion about how profitable this business is, but it’s an unfair comparison.
What’s fairer is to analyse the businesses profitability BEFORE all of the circumstantial costs, like how much interest you’re paying, what your tax situation might be, and how you’ve structured your depreciation schedule.
EBITDA evaluates the profitability of the business in general, whereas Net Profit takes in all of your other circumstances.
They are both useful, but aren’t the same.
What you should start doing by this point
That is, as promised, the basic maths for every business: their revenues (customers x price x frequency) minus their costs (variable costs + fixed costs + startup costs) shows us their margins (and whether they’re currently breaking even or better).
Right now, your task is to have a bad draft attempt at writing out these formulas.
The numbers can be wrong, or close enough, but the important thing is that you’re clear on how the numbers are tallied up.
How do your revenues get calculated?
What goes into each type of cost?
How will we find our breakeven point?
What will be the sign that the business is sustainable?
This doesn’t need a spreadsheet quite yet, it can be on paper (literally an envelope) or whiteboard or Miro board, or the notes app on your phone.
The important part is sitting down and accurately including all the relevant costs and revenue streams – we can make them more precise later on.
Eventually what we want to have are “rules of thumb”, like our earlier example of restaurants having 35% COGS.
It’s not perfect but it’s close enough to be useful, and allows you to draw quick conclusions.
Your industry will have specific guidance and templates for forecasting each of these, so your job now is to take some notes for each of these figures we’re estimating.
Later we can validate our assumptions and improve the financial strength of the business, but for now you’ve done the most important part - drawing up these equations.